
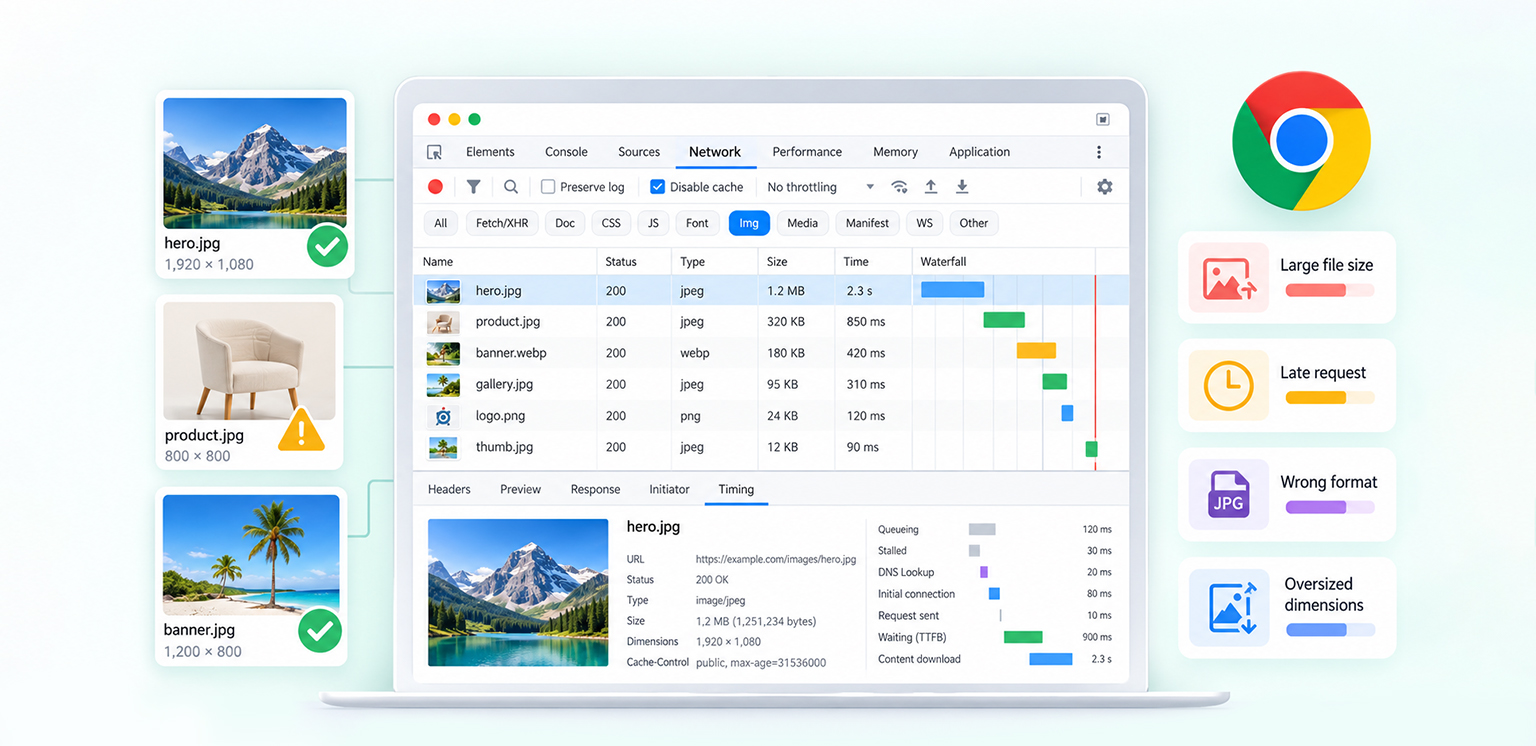
TL;DR: Use Chrome DevTools to identify whether an image problem comes from file size, dimensions, format, request timing, delivery, lazy loading, or rendering. The Network panel is best for image requests and waterfalls, while the Performance panel helps connect image loading to LCP and rendering.
An image can be properly compressed and still slow down a webpage.
A hero image might be small but requested too late. A product image might be displayed at 400 × 400 pixels while the browser downloads a 2,000 × 2,000 version. Or hundreds of images may compete for network resources during the initial page load.
Chrome DevTools makes these problems much easier to diagnose because you can see what the browser actually requested, downloaded, rendered, and displayed.
How Can You Identify Image Performance Issues in Chrome DevTools
Chrome DevTools helps pinpoint whether an image problem comes from file size, dimensions, request timing, loading priority, delivery, or rendering.
| Problem | Where to check | What to look for |
|---|---|---|
| Slow image | Network → Img | Long request duration |
| Oversized image | Network + Elements | Large source versus rendered dimensions |
| Late image request | Network waterfall | Large delay before request starts |
| LCP image | Performance panel | Largest Contentful Paint marker |
| Wrong format | Network → Headers | Content type and delivered resource |
| Too many images | Network → Img | Excessive image requests |
| Rendering issue | Performance panel | Paint, layout, decoding, and main-thread activity |
The key is to determine why an image is slow rather than assuming that compression is always the answer.
Why Use Chrome DevTools for Image Performance Analysis?
PageSpeed Insights can identify image-related opportunities, but DevTools gives you a closer look at what happened during a specific page load.
For example, an image-related LCP problem could be caused by a large file, slow server response, late resource discovery, lazy loading, an oversized responsive image candidate, or rendering work on the main thread.
These require different fixes. If a 100 KB hero image is requested 1 second after the page begins loading, compressing it further may have little impact. The bigger issue is request timing.
For broader image optimization fundamentals, Google’s Learn Images resource covers responsive images, formats, compression, and loading strategies.
How to Check Image Performance in Chrome DevTools
Start with a controlled test so that changes can be compared meaningfully.
Open the page in Chrome, launch DevTools with F12, Ctrl + Shift + I on Windows, or Cmd + Option + I on macOS, and open the Network panel.
If you’re testing a fresh load, enable Disable cache and reload the page. To investigate mobile performance, use Device Mode and apply network throttling.
Keep the viewport, throttling settings, and cache conditions consistent when comparing results.
Filter the Network Panel to Images
Select Img in the Network panel. This gives you a focused list of the page’s image requests, including their URLs, transferred sizes, request duration, response status, and loading order.
Sort by Size to identify potentially heavy images. Then sort by Time to find requests taking unusually long.
Don’t automatically label the largest image as the biggest problem. A 900 KB image that begins loading immediately may affect the user experience less than a 120 KB LCP image whose request starts very late.
Inspect Individual Image Requests
Click an image request to open its details. Under Headers, check the response status, content type, caching information, requested URL, and other delivery details.
Pay particular attention to whether:
- the image is redirected
- the expected CDN or image host is being used
- caching behaves as expected
- the delivered format is appropriate
- the transferred size is much larger than necessary
This is the difference between simply checking an image and actually performing image performance troubleshooting.
How to Read the Image Request Waterfall
The Network waterfall is one of the most useful tools for understanding image requests in Chrome DevTools.
It shows when an image request begins and how long different parts of the request take. This helps answer a critical question:
Is the image slow to download, or did the browser wait too long before requesting it?
| What you see | Likely problem |
|---|---|
| Large image with long download time | File size or delivery |
| Small image requested very late | Discovery, priority, lazy loading, or JavaScript |
| Large gap before an image request | Request initiation delay |
| Many images loading simultaneously | Too many resources competing for bandwidth |
For example, if a 700 KB image starts immediately but takes a long time to download, investigate file size, server response, connection quality, or CDN delivery.
If a 120 KB hero image does not start until much later, investigate how the browser discovers and prioritizes that resource.
Check the Initiator: If an image starts loading unexpectedly late, inspect the request’s initiator information to see whether it was triggered by HTML, CSS, JavaScript, or another resource. This can reveal why the browser did not discover the image earlier.
This distinction is essential when you diagnose slow image loading.
How to Find Oversized Images in Chrome DevTools
A large image can create performance problems in two different ways: its file size may be excessive, or its pixel dimensions may be much larger than its rendered size.
Compare Intrinsic and Rendered Dimensions
Inspect the image in the Elements panel and compare its intrinsic dimensions with the size at which it is displayed.
For example:
<img src="product-2000.jpg"
     width="400"
     height="400"
     alt="Product">
If the browser downloads a 2,000 × 2,000 image for a 400 × 400 display area, you’re potentially transferring unnecessary image data.
Responsive images can allow the browser to select a more suitable source:
<img
  src="product-800.jpg"
  srcset="
    product-400.jpg 400w,
    product-800.jpg 800w,
    product-1200.jpg 1200w"
  sizes="(max-width: 600px) 100vw, 400px"
  width="400"
  height="400"
  alt="Product">
The correct source depends on the viewport, layout, pixel density, and image use case. Simply generating several sizes does not guarantee the browser will choose the most efficient one.
How to Analyze the LCP Image in Chrome DevTools
Images frequently become the Largest Contentful Paint element, particularly on ecommerce and content-heavy pages.
Find the LCP Image
Open the Performance panel, start a recording, reload the page, and stop the recording once the page has loaded.
Look for the Largest Contentful Paint marker.
If the LCP element is an image, inspect its position in the performance timeline and compare it with the image’s network request.
To diagnose LCP, examine its four phases: Time to First Byte (TTFB), resource load delay, resource load duration, and element render delay.
For an image-based LCP element, these phases help you determine whether the delay comes from the server response, late image discovery or request initiation, downloading the image, or rendering the element after the resource loads.
Use the Performance panel alongside the image’s Network timing details to identify which phase contributes most to the delay. An image can be highly compressed and still produce poor LCP if the browser requests it too late or cannot render it promptly.
When you analyze the LCP image in Chrome DevTools, focus on the entire sequence rather than only the image’s file size.
Check Whether the LCP Image Is Lazy-Loaded
Lazy loading is useful for images that are below the fold, but it can be counterproductive when applied to an important above-the-fold image.
Inspect the image HTML:
<img
  src="hero.webp"
  loading="lazy"
  alt="Hero image">
If this image is the LCP element, investigate whether lazy loading is contributing to its delayed request.
That does not mean removing lazy loading from every image. Below-the-fold resources can still benefit from being deferred.
The distinction between these strategies is covered in Preloading vs. Lazy Loading Images.
Use the Performance Panel to Diagnose Rendering Problems
Network timing doesn’t tell the whole story. An image can download quickly but still appear late because the browser has other work to perform.
Look Beyond Image Download Time
When investigating Chrome DevTools Performance panel images, examine the relationship between image loading and:
- LCP
- scripting
- layout
- painting
- image decoding
- main-thread activity
For example, a 100 KB image may finish downloading quickly, but heavy JavaScript could keep the main thread occupied and delay when the image becomes visible.
This is why effective image performance troubleshooting needs both Network and Performance data.
Common Image Performance Problems and What DevTools Reveals
Large Image Files
Inefficient Image Format
-
Image Requested Too Late
- Image Is Larger Than Its Display Size
-
Too Many Image Requests
Symptom: An image transfers hundreds of KB or several MB.
Check: Network → Img → Size.
Likely solution: Resize, compress, or convert the image.
Symptom: Large JPEG or PNG files are being delivered unnecessarily.
Check: Network → Headers → Content-Type.
Likely solution: Evaluate WebP, AVIF, JPEG, PNG, or SVG based on the image.
Symptom: The file is relatively small, but its request begins late.
Check: Network waterfall and Performance panel.
Likely solution: Review resource discovery, loading attributes, JavaScript, CSS, and priority.
Symptom: A large source is downloaded for a relatively small rendered image.
Check: Intrinsic versus rendered dimensions.
Likely solution: Use correctly sized responsive image candidates.
Symptom: The initial page load triggers dozens or hundreds of image requests.
Check: Network → Img.
Likely solution: Defer below-the-fold images, remove unnecessary assets, and review responsive image and loading behavior.
A Practical Image Performance Troubleshooting Workflow
When diagnosing an image problem, avoid changing several things simultaneously. Otherwise, you won’t know which change actually helped.
A more reliable process is:
1. Identify the symptom.
Is LCP slow? Are images visibly delayed? Is the page transferring too many bytes?
2. Filter Network to Img.
Record the largest files, longest requests, and suspicious image URLs.
3. Inspect the waterfall.
Determine whether the problem is delayed request initiation or slow downloading.
4. Inspect the image itself.
Check dimensions, format, compression, and transferred bytes.
5. Find the LCP element.
Use the Performance panel to determine whether an image is actually responsible for LCP.
6. Investigate rendering.
If network timing looks healthy, check scripting, layout, paint, and main-thread activity.
7. Change one variable at a time.
Resize, compress, change the format, adjust loading behavior, or modify delivery, then test again under the same conditions.
This approach makes it easier to distinguish an image-specific problem from a broader page-performance issue.
What to Do After Finding the Image Problem
Once DevTools identifies the issue, match the fix to the evidence.
If the file is genuinely oversized, image optimization can reduce unnecessary bytes through appropriate resizing and compression. For larger image libraries, automated image optimization can make compression and format conversion more consistent across existing and newly uploaded images.
If the file is already small but arrives late, focus instead on resource discovery, loading behavior, priority, server response, caching, or CDN delivery.
And if compressed images still don’t improve the overall performance score, the issue may lie elsewhere.
Conclusion
Diagnosing image performance problems in Chrome DevTools is about finding the actual bottleneck rather than assuming every slow image needs more compression.
Start with Network to inspect image requests, transferred bytes, dimensions, formats, timing, and waterfalls. Then use Performance to connect image loading with LCP, rendering, and main-thread activity.
Once you know whether the problem is file size, image dimensions, request timing, delivery, loading behavior, or rendering, you can apply the right fix instead of optimizing blindly.
The most useful question is not simply, “Is this image optimized?” It is: “What is preventing this image from becoming useful to the visitor as quickly as possible?”
FAQs
Q1: How do I check image performance in Chrome DevTools?
Q2: How do I find slow images in Chrome DevTools?
Q3: How do I find the LCP image in Chrome DevTools?
Q4: How can I find oversized images in Chrome DevTools?
Q5: Does Chrome DevTools show image loading time?
Q6: Can image problems affect Core Web Vitals?
21 October, 2026
Leave a Comment
Ishan Makkar
He is a web performance specialist focused on image optimization and site speed. As the founder of Image Optimizer Pro, he helps businesses reduce image load times and improve Core Web Vitals. His work centers on delivering faster websites, better user experience, and measurable SEO gains without complex development.