
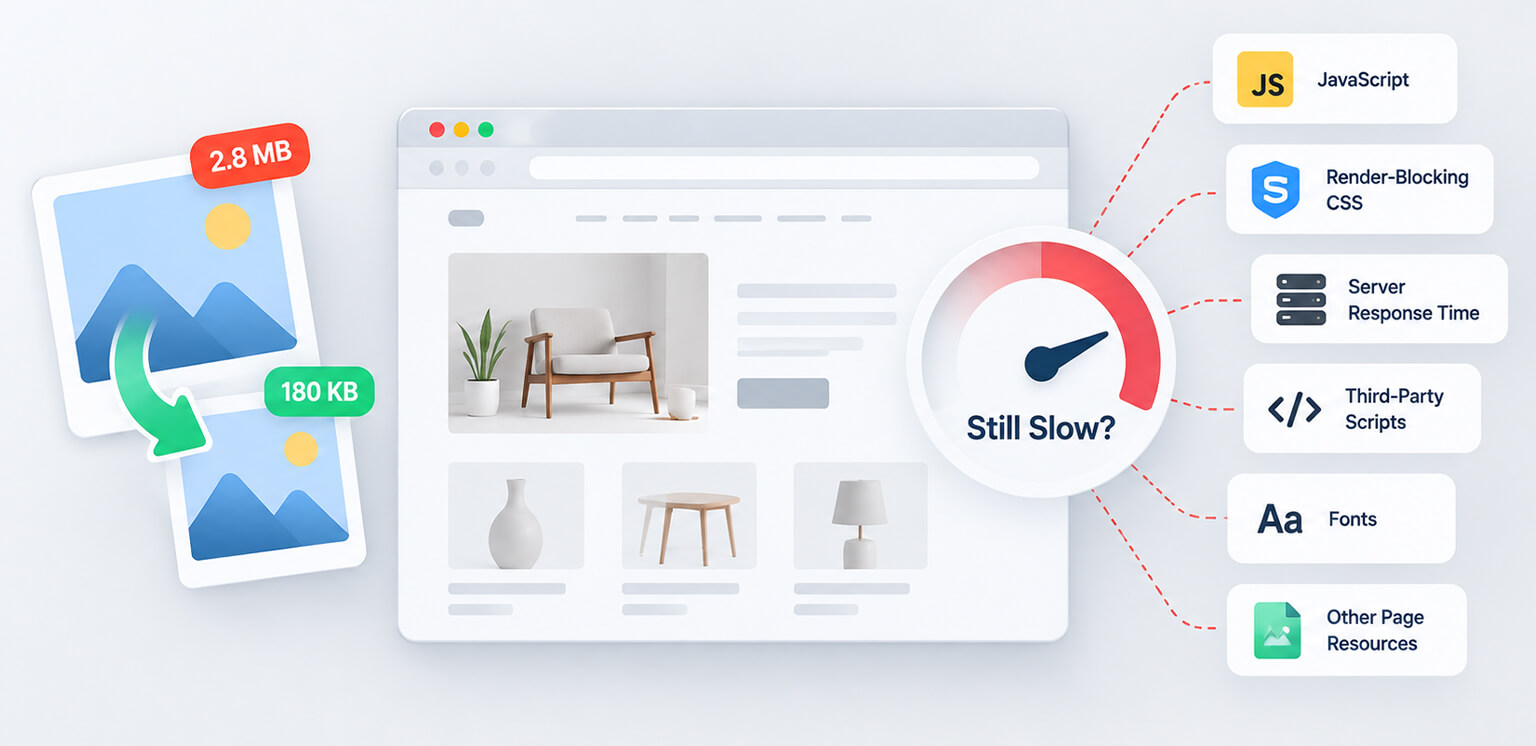
TL;DR: If your website is still slow after image compression, images may no longer be the main issue. Check image dimensions and loading behavior first, then investigate JavaScript, CSS, server response time, third-party scripts, fonts, caching, and other page resources.
You compressed your images, converted them to WebP or AVIF, reduced their file sizes, and expected your website to become noticeably faster. But the website is still slow after image compression.
That does not necessarily mean image optimization failed. Image compression only addresses one part of website performance. A page can still be slow because of JavaScript, render-blocking CSS, slow server response, third-party scripts, oversized resources, or a poorly prioritized LCP element.
The real question is: what is slowing the page down now?
Slow Website Speed After Image Compression: Causes and Fixes
Image compression reduces image file sizes, but it cannot fix other performance issues. If your site remains slow, check LCP, TTFB, JavaScript, CSS, third-party scripts, image loading behavior, and overall page weight.
| Problem | Likely cause | First thing to check |
|---|---|---|
| Images are optimized, but LCP is slow | Server delay or image loading priority | LCP element and TTFB |
| Page loads but feels unresponsive | Heavy JavaScript | Main-thread activity and INP |
| Content appears late | Render-blocking CSS/JS | Critical rendering path |
| Mobile is much slower | Large resources or CPU-heavy scripts | Mobile PageSpeed results |
| Page remains heavy | JS, fonts, video, embeds, or third-party tools | Network payload |
| PageSpeed still flags images | Wrong dimensions or loading strategy | Image request and rendered size |
PageSpeed Insights evaluates multiple aspects of page performance, not simply image file sizes. That is why image compression not improving page speed is often a sign that another underlying issue needs attention.
What Is Still Slowing Down Your Website After Image Optimization?
Optimized images may no longer be the main cause of slow performance. Slow server response, JavaScript, CSS, third-party scripts, poor image loading priorities, and other heavy resources can still delay your website.
1. Your LCP image is loading too late
You can have a perfectly optimized hero image and still have poor LCP if the browser discovers it too late.
This can happen when the browser discovers the image late, such as when it is injected through JavaScript or used as a CSS background image, or when its loading priority is too low.
What to do:
Identify the actual LCP element in PageSpeed Insights. If it is a critical above-the-fold image, make sure it is discoverable early and consider appropriate prioritization such as fetchpriority="high".
<img
  src="hero.webp"
  width="1200"
  height="700"
  fetchpriority="high"
  alt="Online store homepage">
Don’t use high priority on every image. The goal is to help the browser identify the genuinely important resource.
2. JavaScript is slowing down page rendering
This is one of the most common reasons for a website to be slow despite image optimization.
Your images might be only a few hundred kilobytes, while JavaScript from apps, analytics, chat widgets, personalization tools, reviews, filters, and other integrations can add substantial download and processing work.
More importantly, JavaScript isn’t just a file-size problem. The browser also has to parse, compile, and execute it. Heavy JavaScript can keep the main thread busy and affect responsiveness and INP.
What to do:
Remove unused scripts, delay non-critical JavaScript, reduce third-party tools, and break up large scripts where practical.
3. You’re lazy-loading the wrong images
Lazy loading is useful for images below the fold, but applying it to your hero or LCP image can delay the most important visual content.
That means your images may be compressed correctly while the browser is intentionally waiting before requesting them.
What to do:
Keep lazy loading for non-critical, below-the-fold images. Let important above-the-fold content load normally unless there is a specific reason to delay it.
4. Render-blocking CSS is delaying the page
A page can have optimized images and still appear slow because the browser is waiting for CSS or JavaScript before it can render important content.
Large stylesheets, unused CSS, and resources required before the browser can render important content can all contribute to this problem.
What to do:
Identify render-blocking resources, reduce unnecessary CSS, prioritize critical styles, and defer non-critical resources where appropriate.
5. Your server is slow before images even start loading
Sometimes the problem occurs before the browser downloads your optimized images. If the server takes too long to return the initial HTML document, visitors experience a delay before the rest of the page can begin loading.
This is where Time to First Byte (TTFB) becomes important. Common causes include slow hosting, database processing, server-side rendering, redirects, weak caching, and a distant origin server.
What to do:
Check TTFB in PageSpeed Insights or Chrome DevTools. If it is consistently high, investigate hosting, server processing, caching, and CDN configuration instead of compressing more images.
6. Third-party scripts are slowing everything down
Analytics, ads, live chat, social widgets, review tools, A/B testing, and marketing platforms can quietly accumulate on a website.
Even when each script seems small, the combined effect can increase requests, network activity, and browser processing.
What to do:
Audit every third-party script. Remove tools that are no longer necessary and delay or defer those that aren’t needed for the initial page experience.
7. Your Images Aren’t Being Served at the Right Size
Image compression is only one part of image optimization. Even a well-compressed image can affect performance if the browser downloads a much larger version than the space where it is displayed.
For example, a 2400 × 1600 image displayed at 600 × 400 still requires the browser to download more pixels than necessary. This can be especially noticeable on mobile devices.
What to do:
Match image dimensions to their actual display size and use responsive images so browsers can select an appropriate file for the user’s screen.
<img
  src="product-800.webp"
  srcset="
    product-400.webp 400w,
    product-800.webp 800w,
    product-1200.webp 1200w"
  sizes="(max-width: 600px) 100vw, 600px"
  width="600"
  height="600"
  alt="Blue running shoes">
Google’s image delivery guidance recommends serving appropriately sized images instead of unnecessarily large resources.
8. Fonts, videos, and other assets are being overlooked
When troubleshooting a website still slow after compressing images, it’s easy to keep looking at images because they’re visually obvious.
But large font files, background videos, embedded content, maps, and other assets can also add considerable weight or processing work.
What to do:
Open Chrome DevTools → Network, reload the page, and sort resources by size. If JavaScript, fonts, videos, or embeds are larger than your remaining image payload, shift your optimization efforts there.
9. Too many images can still create a heavy page
Individual images may be optimized while the total image payload remains excessive.
For example, a product page with 30 compressed product images can still require much more data than a page with five carefully selected images.
Compression reduces the amount of data each image transfers, but every image that is requested can still add network and browser work.
What to do:
Remove unnecessary or duplicate images, avoid loading gallery images before they’re needed, and lazy-load appropriate below-the-fold content.
How to Troubleshoot a Website That’s Still Slow After Image Compression
Once your images are compressed, don’t keep optimizing them blindly. Find the resource that is actually responsible for the delay.
Step 1: Check PageSpeed Insights
Run the affected URL through PageSpeed Insights and look beyond the overall score. Pay particular attention to:
| Metric | What it helps identify |
|---|---|
| LCP | Loading and rendering delays |
| INP | JavaScript and interaction problems |
| CLS | Layout instability |
| TTFB | Server and network delays |
| FCP | Initial rendering problems |
| Total payload | Overall resource weight |
Core Web Vitals measure different parts of the user experience, so improving one area doesn’t automatically fix the others.
Step 2: Find the actual LCP element
Don’t assume the hero image is your LCP. PageSpeed Insights can tell you whether the LCP element is an image, heading, text block, or another element.
If the LCP element isn’t an image, further image compression is unlikely to solve the main problem.
Step 3: Inspect the Network panel
Chrome DevTools provides a useful reality check.
Sort requests by
- Transfer size
- Duration
- Request type
- Initiator
If the largest resources are JavaScript files rather than images, you have a clear indication of where to investigate next.
Step 4: Compare mobile and desktop
A website that feels fast on a modern desktop can perform very differently on a mobile device. Mobile users may have slower connections and less processing power, so large JavaScript bundles and excessive resources can become much more noticeable.
Always test the mobile experience separately rather than assuming desktop results represent everyone.
Why Image Compression Alone Can’t Fix Website Speed
Image compression is still an important part of website performance. It reduces the number of bytes visitors need to download and can improve image loading and LCP when images are a genuine culprit.
But image compression vs. website speed isn’t a choice between two separate strategies.
Think of it as a chain:
Server response → HTML → CSS/JS discovery → image discovery → resource downloads → rendering → interaction
Image optimization improves one or more parts of that chain. It cannot repair every other part.
For example, reducing a hero image from 500 KB to 150 KB can be valuable. But if the browser spends another two seconds waiting for JavaScript or the server, the overall experience may still feel slow.
What to Fix After Image Compression
Once you’ve confirmed that images are properly compressed and sized, use this order:
- Check the LCP element and loading priority.
- Review TTFB and server response time.
- Reduce unnecessary JavaScript.
- Fix render-blocking CSS and scripts.
- Audit third-party resources.
- Review fonts, videos, and embedded content.
- Reduce unnecessary image requests.
- Check caching and CDN delivery.
- Retest mobile performance.
- Compare results before and after each major cha
The key is to fix the largest remaining issue rather than repeatedly optimizing something that is already performing well.
Conclusion
If your website is still slow after image compression, don’t immediately assume that you need even smaller images.
Image optimization is important, but website speed depends on the entire loading process. Once images are properly compressed, sized, and delivered, the next issue may be JavaScript, CSS, server response time, third-party scripts, fonts, videos, or resource prioritization.
The most effective approach is to measure first, identify the actual issue, and then optimize that specific part of the page. That prevents wasted effort and gives you a much clearer path toward better website performance and Core Web Vitals.
Frequently Asked Questions
Why is my website still slow after image compression?
Does compressing images always improve PageSpeed?
Why is image compression not making my website faster?
Can optimized images still slow down a website?
Should I compress images again if PageSpeed is still slow?
What should I check first when images are optimized but my website is still slow?
18 September, 2026
Leave a Comment
Ishan Makkar
He is a web performance specialist focused on image optimization and site speed. As the founder of Image Optimizer Pro, he helps businesses reduce image load times and improve Core Web Vitals. His work centers on delivering faster websites, better user experience, and measurable SEO gains without complex development.