
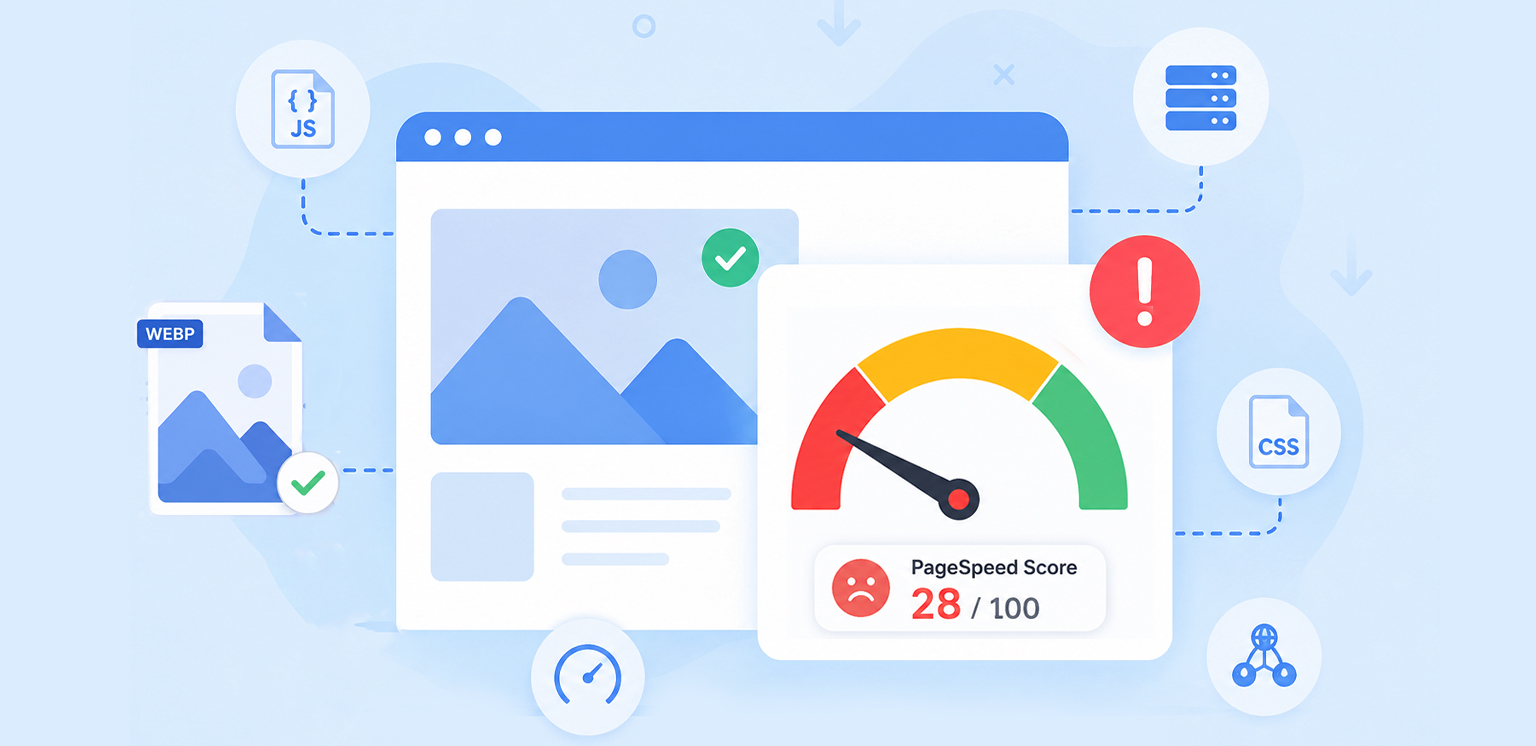
TL;DR: When optimized images still don’t improve PageSpeed score, the underlying issue is often elsewhere on the page. This article explains why PageSpeed Insights may continue reporting performance issues after image optimization and helps you identify the technical factors that have the greatest impact on loading speed, user experience, and Core Web Vitals.
Many website owners invest time in image performance optimization by compressing files, converting images to modern formats, and implementing responsive images, expecting their PageSpeed score to improve.
Then comes the surprise. You run another PageSpeed Insights test, only to find that the score has barely changed. One of the most common website performance issues is discovering that optimized images still don’t improve PageSpeed score as much as expected.
The reason is simple: PageSpeed Insights evaluates the overall loading experience of a page, not just image files. While images play an important role, other factors can have a much bigger impact on performance and Core Web Vitals.
Quick Answer: Why Your PageSpeed Score Is Still Low After Image Optimization
Optimizing images improves only one part of website performance. PageSpeed Insights also measures factors like JavaScript execution, render-blocking CSS, server response times, layout stability, and third-party scripts. If these issues remain, your PageSpeed score may stay low even after image optimization.
| Common Issue | Effect on PageSpeed |
|---|---|
| Excessive JavaScript | Delays rendering, interactivity, and Core Web Vitals metrics |
| Incorrect LCP Element Optimization | The actual Largest Contentful Paint element remains slow |
| Slow Server Response Times | Delays the loading of all page resources |
| Render-Blocking CSS and Fonts | Prevents content from rendering quickly |
| Unprioritized Images | Critical above-the-fold images load too late |
| Misinterpreting PageSpeed Data | Strong lab results may hide poor real-user performance |
| Layout Shift Issues (CLS) | Reduces visual stability and user experience |
| Third-Party Scripts | Add extra network requests and processing overhead |
In short, image optimization is important, but it is rarely the only factor affecting PageSpeed Insights scores. Modern performance metrics evaluate the entire loading experience, including JavaScript, server performance, Core Web Vitals, resource prioritization, and user interactions.
How PageSpeed Insights Calculates Your Performance Score
Before troubleshooting image optimization not improving PageSpeed, it’s important to understand what PageSpeed Insights actually measures.
Google’s PageSpeed Insights uses Lighthouse performance audits and evaluates multiple metrics, including:
| Metric | What It Measures |
|---|---|
| Largest Contentful Paint (LCP) | Loading speed of the main visible content |
| Interaction to Next Paint (INP) | Responsiveness after user interaction |
| Cumulative Layout Shift (CLS) | Visual stability |
| First Contentful Paint (FCP) | Initial content rendering |
| Speed Index | Visual loading progress |
| Total Blocking Time (TBT) | Time blocked by JavaScript execution |
According to Google Lighthouse, Largest Contentful Paint (LCP), Total Blocking Time (TBT) in lab testing, and Cumulative Layout Shift (CLS) contribute significantly to Lighthouse performance scores. For real-user performance, Interaction to Next Paint (INP) replaces TBT as the responsiveness metric in Core Web Vitals.
This is why image optimization and PageSpeed Insights do not always correlate as directly as many website owners expect.
Start With an Image Optimization Reality Check
If PageSpeed Insights is still reporting oversized images, next-generation format recommendations, or improper image sizing, those issues should be fixed before investigating non-image issues. Many websites believe their images are optimized when PageSpeed Insights still detects image-related opportunities.
| Optimization Area | What to Check |
|---|---|
| Compression | Images are compressed without noticeable quality loss |
| Modern Formats | WebP or AVIF is used where supported |
| Proper Sizing | Images are not significantly larger than their display dimensions |
| Responsive Images | srcset and responsive image delivery are implemented |
| Lazy Loading | Offscreen images load only when needed |
| Image Dimensions | Width and height attributes are specified |
If PageSpeed Insights continues surfacing image-related opportunities, addressing those PageSpeed Insights recommendations should be your first priority before investigating broader performance issues.
Common Causes of Low PageSpeed Scores Beyond Image Optimization
If your images are already compressed, properly sized, and served in modern formats like WebP and AVIF, other performance issues may be preventing meaningful PageSpeed improvements. The following are the most common causes.
Reason 1: JavaScript Is Slowing Down Your Site
Even when images are fully optimized, excessive JavaScript can significantly impact PageSpeed performance. Large scripts can block the browser’s main thread, delaying rendering, interactivity, and Core Web Vitals metrics.
Common Causes
- Unused JavaScript
- Third-party tracking scripts
- Chat widgets and marketing tools
- Excessive apps, plugins, integrations, or third-party scripts
- Large framework bundles
Practical Fixes
- Remove unused JavaScript
- Delay non-critical scripts
- Reduce third-party tools
- Minify and split JavaScript files
- Audit plugin usage regularly
Reason 2: Your LCP Element Isn’t the Image You Think It Is
Many website owners focus on LCP image optimization without verifying which element is actually being measured as the Largest Contentful Paint. In some cases, a heading, text block, or dynamically rendered component becomes the LCP element instead of the optimized image.
Common Causes
- Hero text is larger than the image
- Delayed content rendering
- Client-side rendered components
- Large banners or content blocks
- Incorrect assumptions about the LCP element
Practical Fixes
- Identify the actual LCP element in Lighthouse
- Optimize the element contributing to LCP
- Reduce render delays
- Prioritize above-the-fold content
- Test changes using PageSpeed Insights
Reason 3: Slow Server Response Times
Image optimization cannot compensate for slow hosting or delayed server responses. Although Time to First Byte (TTFB) is no longer a Core Web Vital, it still affects Largest Contentful Paint (LCP) because a slow HTML response delays every critical resource, including CSS, JavaScript, fonts, and images, and lowers your PageSpeed score.
Common Causes
- Shared hosting limitations
- Slow database queries
- Poor caching setup
- High server load
- No CDN implementation
Practical Fixes
- Upgrade hosting infrastructure
- Enable server-side caching
- Optimize database performance
- Use a CDN
- Monitor Time to First Byte (TTFB)
Reason 4: Render-Blocking CSS and Fonts
Even optimized images can be delayed if the browser must process large CSS files or custom fonts before rendering content. This can negatively affect LCP and overall PageSpeed performance.
Common Causes
- Large CSS files
- Unused stylesheets
- Multiple font families
- Excessive font weights
- Render-blocking resource loading
Practical Fixes
- Inline critical CSS
- Remove unused CSS
- Preload key fonts
- Use
font-display: swap - Reduce unnecessary font variations
Reason 5: Images Are Optimized but Not Prioritized
Reducing image file size is only part of the equation. If important above-the-fold images are not prioritized, they may still load later than necessary and impact LCP.
Common Causes
- Missing image preload hints
- No fetch priority settings
- Delayed hero image loading
- Incorrect lazy-loading implementation
- Resource competition during page load
Practical Fixes
- Prioritize LCP images
- Use
fetchpriority="high" - Preload critical images
- Avoid lazy loading above-the-fold images
- Optimize resource loading order
Reason 6: You Are Looking at the Wrong PageSpeed Data
Many site owners focus only on lab data while ignoring field data. As a result, they may see strong test results but continue receiving poor real-world Core Web Vitals scores.
Common Causes
- Reliance on simulated testing only
- Poor user network conditions
- Slow mobile devices
- Geographic performance variations
- Misinterpretation of PageSpeed reports
Practical Fixes
- Review both Lab and Field Data
- Monitor Core Web Vitals regularly
- Test on mobile devices
- Analyze real-user monitoring data
- Compare performance across regions
Reason 7: Layout Shifts Are Hurting Performance
Images affect more than loading speed. If image dimensions are not properly reserved, content can shift during loading, negatively affecting visual stability metrics.
Common Causes
- Missing width and height attributes
- Dynamically injected content
- Responsive images without dimensions
- Ads and embeds loading late
- Improper layout reservation
Practical Fixes
- Define image dimensions
- Reserve space for dynamic content
- Test pages for layout shifts
- Optimize responsive image implementation
- Monitor CLS in PageSpeed Insights
Reason 8: Third-Party Scripts Are Slowing Down Your Site
Third-party scripts often continue affecting performance even after image optimization is complete. Analytics tools, chat widgets, advertising networks, social media embeds, and tag managers can introduce additional requests, processing time, and JavaScript execution that negatively impact PageSpeed metrics.
Common Causes
- Multiple analytics and tracking tools
- Chat and customer support widgets
- Social media embeds
- Advertising and marketing scripts
- Tag management platforms loading excessive tags
Practical Fixes
- Remove unnecessary third-party scripts
- Load non-critical scripts after page rendering
- Limit the number of tracking tools
- Audit tag manager configurations regularly
- Use lightweight alternatives where possible
Quick Troubleshooting Checklist
If optimized images haven’t improved your PageSpeed score, review the remaining performance issues in your report and fix the biggest one first, since that usually has the most impact.
| Issue | Typical Fix |
|---|---|
| Heavy JavaScript | Remove unused scripts |
| Slow Hosting | Improve server response times |
| Poor LCP | Optimize actual LCP element |
| Render-Blocking CSS | Inline critical CSS |
| Unprioritized Images | Preload LCP images |
| CLS Issues | Define image dimensions |
| Third-Party Scripts | Reduce external requests |
Conclusion
When optimized images still don’t improve PageSpeed score, the issue is rarely the images themselves. Modern image formats, compression, and responsive delivery remain important, but they are only one part of website performance.
To truly improve Google PageSpeed score results, you must examine the entire loading experience, from server response times and JavaScript execution to render-blocking resources, Core Web Vitals, and resource prioritization. The most successful optimization strategies treat images as one component of a broader performance ecosystem rather than the sole solution to speed problems.
FAQs
Q1. Why is my PageSpeed score still low after optimizing images?
Q2. Does image optimization guarantee a higher PageSpeed score?
Q3. What should I check after optimizing images?
Q4. Can JavaScript affect PageSpeed more than images?
Q5. What is the most important image for PageSpeed?
Q6. Why does PageSpeed still report image issues after optimization?
3 July, 2026
Leave a Comment
Ishan Makkar
He is a web performance specialist focused on image optimization and site speed. As the founder of Image Optimizer Pro, he helps businesses reduce image load times and improve Core Web Vitals. His work centers on delivering faster websites, better user experience, and measurable SEO gains without complex development.